Since this morning's update, single sign-on sends me back to the login page every time I authenticate. I've cleared cookies twice.
Dependable Models™
The sturdy compute layer for text.
Classify any volume. Run complex experiments over text and metadata. Get structured, reproducible results linked to the source.
1,000
input tokens / second / core
one-time ingestion, no GPUs
0
output tokens
structured data, not generation
~10×
fewer labeled examples
than fine-tuned transformers
100%
reproducible
identical results on every run
01 · A different approach
Joint probability models are the workhorses of science. Sturdy Statistics made them operational for text analysis.
Trained only on your data
Each model is trained exclusively on one customer's data. There is no pretraining corpus, so every result is grounded in documents that can be inspected.
Explicit structure
Every document, paragraph, sentence, and word is annotated with interpretable topics. Each column has a meaning, and most values are zero.
Quantified uncertainty
Estimates are Bayesian. Rare patterns are held to a higher standard of evidence, and results are identical on every run.
02 · Classification
Text classification at unlimited scale, for a flat cost.
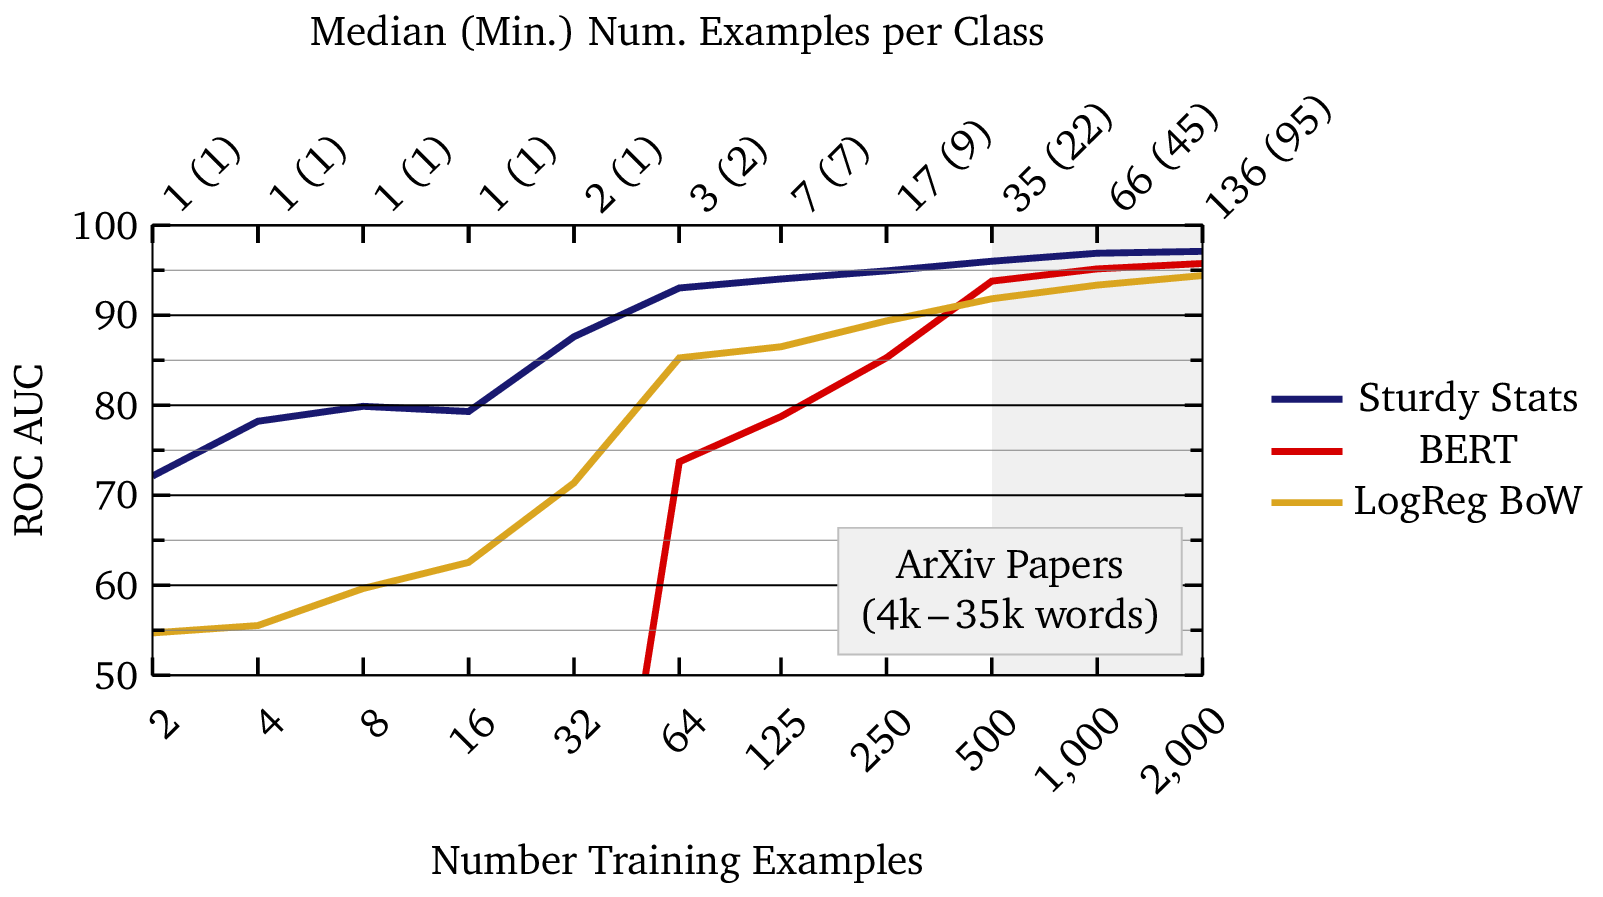
- Few-shot. Useful with a few labeled examples per class; saturates with a few dozen.
- Unlimited scale. Any volume of documents at a flat cost, with no per-token or per-document charges.
- Calibrated. Scores are probabilities, so thresholds and review queues behave predictably.
- Error-tolerant. Accuracy holds when a portion of the training labels are wrong.
- Explainable. Each prediction identifies the sentences and words that produced it.
03 · Structured experiments
Every question is a structured experiment.
Outcome
any column or expression+
Test group
SQL filter+
Control group
SQL filter=
topics/metricdenoised metric estimates for every topic in test vs. control
topics/metric
What is the top-performing rep doing differently?
ix.topics_metric("paragraph",
    test_metric="won",
    test_subset="rep_id = 'R-07'",
    control_subset="rep_id != 'R-07'")
12,480 recorded sales calls with CRM outcomes
| Topic | Mentions | Rep R-07 | Team | Difference |
|---|---|---|---|---|
| Security review | 97 | 48% | 31% | +17 pts |
| Pricing objections | 214 | 43% | 27% | +16 pts |
| Implementation timeline | 148 | 46% | 35% | +11 pts |
| Multi-year terms | 63 | 30% | 31% | −1 pt |
Win rate on calls where each topic occurs. Each row expands into the passages behind it for the top-performing rep and the rest of the team.
topics/metric
Why did customer satisfaction drop after the new release?
ix.topics_metric("doc",
    test_metric="csat",
    test_subset="quarter = '2025Q2'",
    control_subset="quarter = '2025Q1'")
31,640 support conversations with post-contact satisfaction scores (1–5)
| Topic | Mentions | 2025 Q1 | 2025 Q2 | Difference |
|---|---|---|---|---|
| SSO login loop | 1,236 | 4.1 | 2.3 | −1.8 |
| CSV export timeout | 822 | 3.6 | 3.1 | −0.5 |
| Billing questions | 1,010 | 3.8 | 3.9 | +0.1 |
| New dashboard filters | 538 | 3.9 | 4.5 | +0.6 |
Average satisfaction on conversations where each topic occurs. See the excerpts behind the first row.
topics/metric
Did the latest website change hurt conversion?
ix.topics_metric("doc",
    test_metric="converted",
    test_subset="site_version = '2.7'",
    control_subset="site_version = '2.6'")
48,210 customer conversations with website version and conversion outcome
| Topic | Mentions | Version 2.6 | Version 2.7 | Difference |
|---|---|---|---|---|
| Checkout button unresponsive | 1,184 | 22% | 9% | −13 pts |
| Promo code rejected | 2,306 | 18% | 12% | −6 pts |
| Shipping cost at checkout | 3,411 | 25% | 24% | −1 pt |
| Product filters | 1,748 | 20% | 29% | +9 pts |
Conversion rate on conversations where each topic occurs. Values are denoised, and each row links to the text behind it.
Examples are illustrative.
04 · Explainability
Every result links to the text behind it.
- Document
- Which documents contribute to a result, and by how much.
- Paragraph
- The passages that carry a topic, ranked by topic weight.
- Sentence
- The specific statements responsible for a prediction.
- Word
- The terms associated with each topic.
# paragraphs behind the "SSO login loop" row
ix.search("paragraph",
    topic_ids=[117],
    filter="quarter = '2025Q2'")
Our whole team is locked out. Okta says the sign-in succeeded, then the app redirects to login again.
The SSO redirect loops unless I open the app in a private window. This started after the latest release.
Example is illustrative.
05 · Engine
A statistical engine in C, on standard CPUs.
- Engine
- Written in C17. Each inference step reduces to a two-dimensional loop that fits in CPU cache and vectorizes.
- Throughput
- Ingests more than 1,000 tokens per second per core. Queries run against the stored model without rereading or regenerating the source text.
- Storage
- Sparse topic arrays in DuckDB, stored alongside the metadata and queryable with SQL.
- Deployment
- Standard CPUs. Models are isolated per customer; multi-tenant, single-tenant, or on-premise.
06 · FAQ
Frequently asked questions
Why not use an LLM for analysis?
LLM conclusions depend on how the input is presented. In a published test, a frontier model at high reasoning effort was asked to recommend a dishwasher brand from the same customer reviews, 60 times in each of two orderings.
| Review order | Brand shown last | Recommendation |
|---|---|---|
| Alphabetical (A→Z) | Maytag | Maytag, 40 of 59 runs |
| Reverse (Z→A) | Bosch | Bosch, 59 of 60 runs |
The same reviews were used in both conditions. One A→Z run failed.
The model favored whichever brand appeared last.
LLMs are effective for reading and writing text. Conclusions about a dataset require a model of the dataset.
Does Dependable Models use an LLM?
Topics, statistics, experiments, and predictions are computed by the Bayesian model. An LLM can optionally be used to name topics or to summarize results the model has already produced.
How do they differ from embeddings and clustering?
Embedding dimensions are not interpretable, and clusters are flat. Dependable Models produce named, hierarchical topics at every level of a document, with uncertainty estimates, that can be joined to metadata and tested directly.
Is it always right?
No model is. Because every prediction identifies the text that produced it, errors can be examined directly. In this example, a patent filed under General was classified as Textiles; the sentences responsible describe nonwoven fibres, wet spinning, and the textile industry.
s105Hydroentanglement techniques conventionally used in the textile industry for consolidating nonwoven webs of fibres…
s195…including conventionally known techniques such as wet spinning techniques.
s313…tissue engineering, 3-D cell culturing, and drug-releasing fabrics.
How much data is required?
Topic structure can be learned from a small corpus; experiments become precise at around a thousand documents. Classifiers are useful with a few labeled examples per class and saturate with a few dozen.
How is it priced?
Flat and predictable. There are no per-token, per-document, or per-query charges.
Where is data processed?
Models are trained only on a customer's data and are never used for other customers. Deployment options include multi-tenant, single-tenant, and on-premise.
Run Dependable Models on your own data.
Sturdy Statistics works directly with technical teams on text classification, structured experiments, and high-volume corpus analysis.
Send a note
Thanks. The message was sent to Sturdy Statistics.
or
Prefer to schedule a conversation or review the technical overview first?